Analytics on the VKURSE platform
Access and capabilities
Each user can see statistics on their events in the "Settings" - "Event Statistics" section. However, to track overall statistics for all events and peak values within the purchased license, a separate service stats.vkurse.ru has been developed.
ACCESS
To access this service, you need to request it at support@vkurse.ru, after which you will be sent a password for login.
After logging into the site, the first thing you need to do is specify the dates - for which period you want to analyze the indicators and click "Show Statistics".

There is an option to "Download Statistics" for the selected period in excel and csv formats, in this case, the file will reflect all peak values and clients used for each day of the selected period. The site displays summary information with peak values for the entire period.
First of all, basic indicators are reflected on the right side:
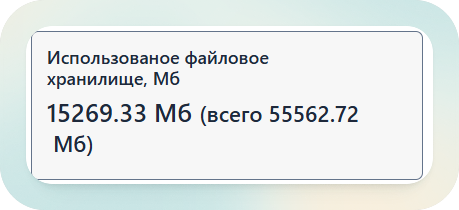
- Storage used.
The first indicator - what volume was uploaded in the specified period, below in parentheses - the total used volume.
- Total registered users for the period.
The first indicator - how many new users were registered in the selected period, below in parentheses - how many were registered in total for your company.

On the left side, the main peak values of license usage are reflected, as in the example below:
Dashboard structure
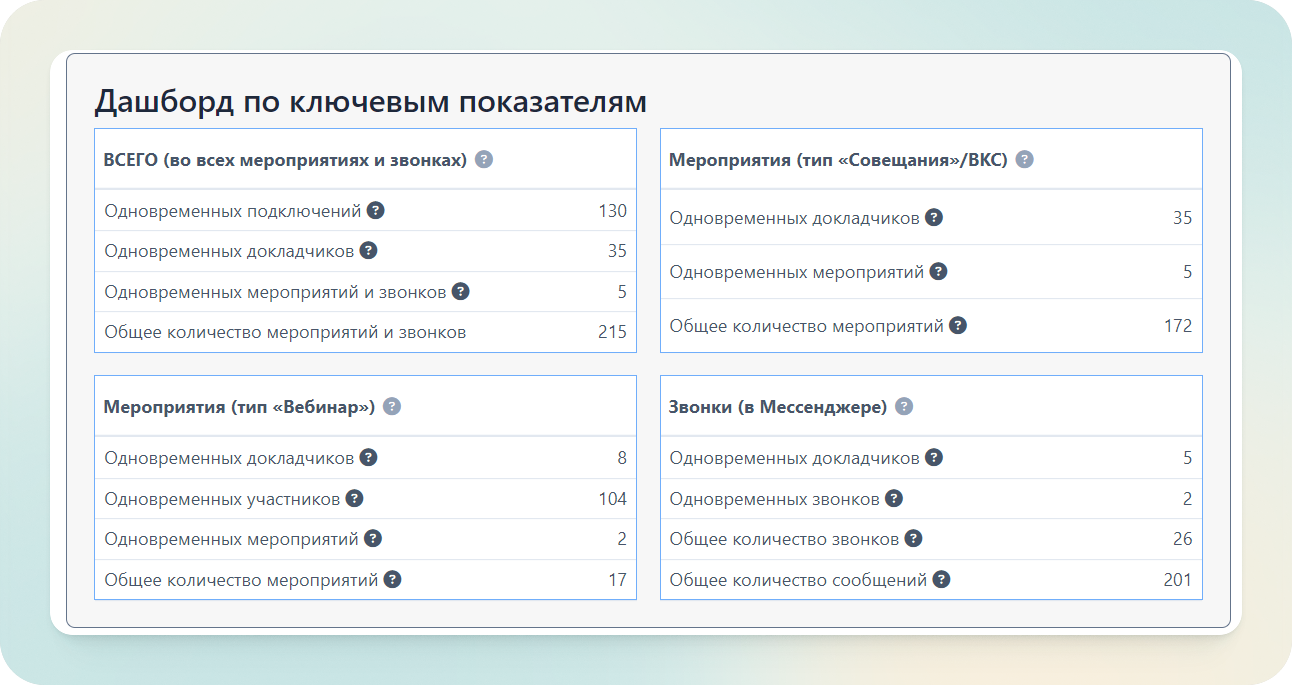
The dashboard consists of 4 sections:
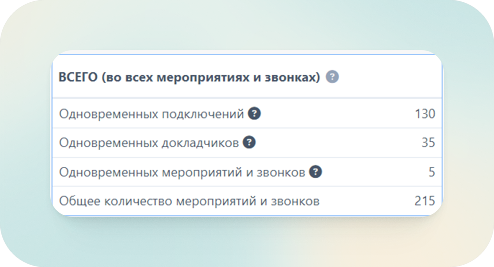
TOTAL (in all events and calls). Since the tariff has limitations on the number of simultaneous speakers and parallel events, we recommend paying special attention to these indicators.
- Simultaneous connections - takes into account all types of connections, in any role and in any type of event, including P2P calls in the messenger at one moment in time.
- Simultaneous speakers. This indicator includes all participants in events of the "Meeting" ("Conference") type, participants with the role of speaker or moderator in a webinar, as well as participants in P2P calls in the messenger at one moment in time.
- Simultaneous events = parallel events - includes all types of events and online calls in the messenger.
- Total number of events and calls - the total number for the entire selected period, has no limitations in the tariff.
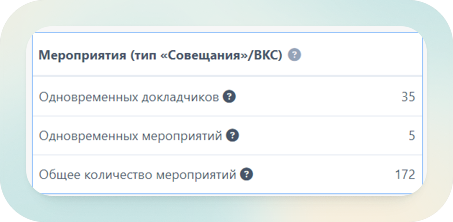
Events (Meeting/Conference type) - displays statistics only for the "Meeting" ("Conference") templates. Special templates "Selector" and "Lecture" are also available on the platform, they also belong to this type of events.
- The "simultaneous speakers" indicator essentially reflects all participants at the peak, regardless of role, as
webrtcconnections are meant. - The "simultaneous events" indicator shows intersections only for this type of events.
- The "simultaneous speakers" indicator essentially reflects all participants at the peak, regardless of role, as
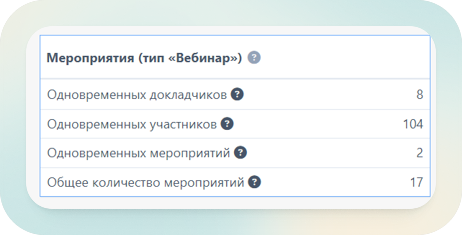
- Events (Webinar type) - displays statistics only for the "Webinar" templates.
IMPORTANT
With this type of connection, participants with the roles of "Moderator" and "Speaker" connect as WebRTC, and participants as WebRTMP, so they cannot turn on the camera and sound. Therefore, these indicators are separately highlighted in the statistics:
Simultaneous speakers -
WebRTCUsers at peak value for all events of the "Webinar" template.Simultaneous participants -
WebRTMPUser at peak value for all events of the "Webinar" template.Simultaneous events - indicator only for this type of events.
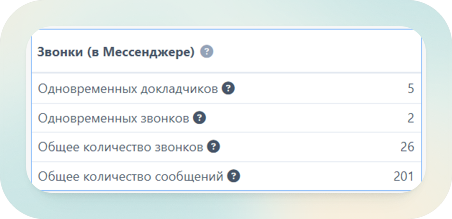
- Calls (in messenger) -
P2Pcalls available between registered users in the "Chats" section without creating events or entering rooms. Participants in such calls are identified as speakers. Calls can be both personal and group. The statistics also show the total number of all messages in the messenger.
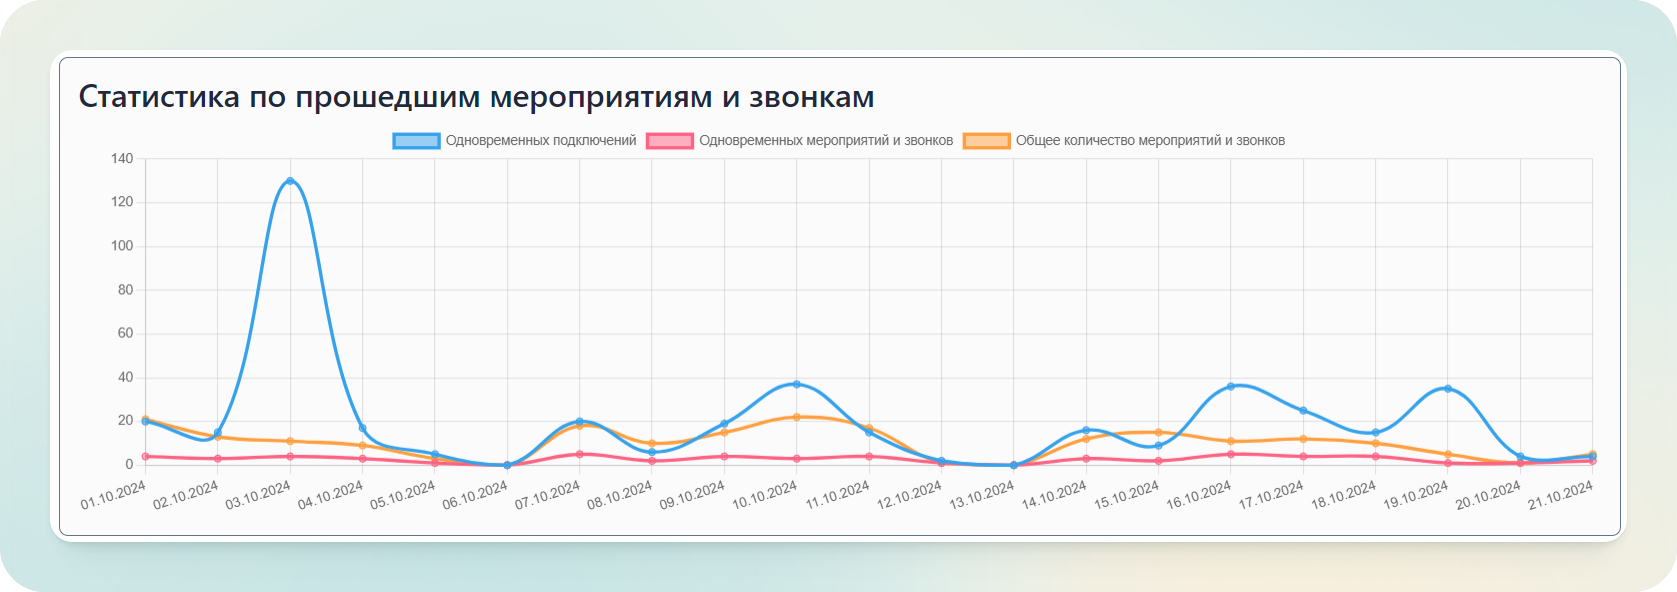
Below the dashboard, there are graphical representations for the same 4 main directions: all events and calls, only VKS, only webinars, only calls. The graph allows you to see indicators for all days and better understand the average values and in which day there was a peak and how the overall peaks relate to the maximum values for individual types of events.
After the graphs for all communication formats, there is a graph available for registered users, showing from which devices and client types users log into the VKURSE platform.

The section "User Statistics" allows you to see who conducted the largest events. By clicking on any of the fields at the top, the data will be filtered from maximum to minimum.
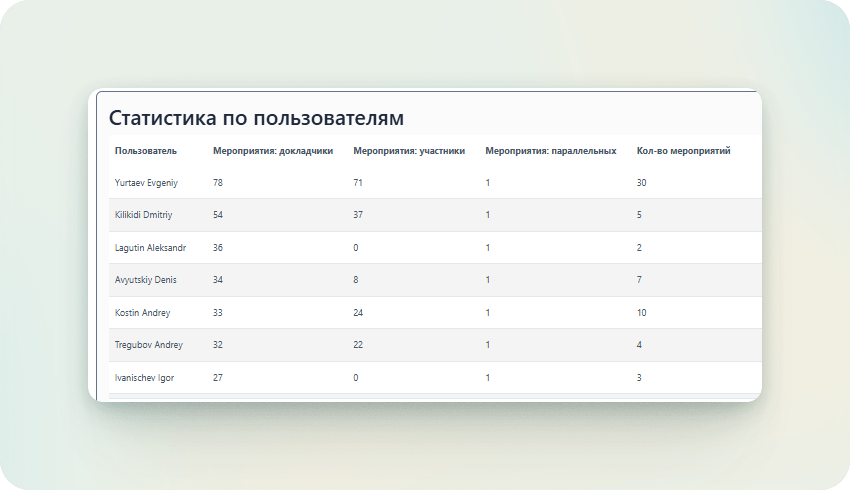
| Field | Value |
|---|---|
| Events: speakers | the maximum number of speakers in events and rooms created by the user |
| Events: participants | The maximum number of listeners in events and rooms created by the user |
| Parallel events | The maximum number of simultaneous meetings/webinars created by the user |
| Number of events | How many events were created by the user for the selected period |
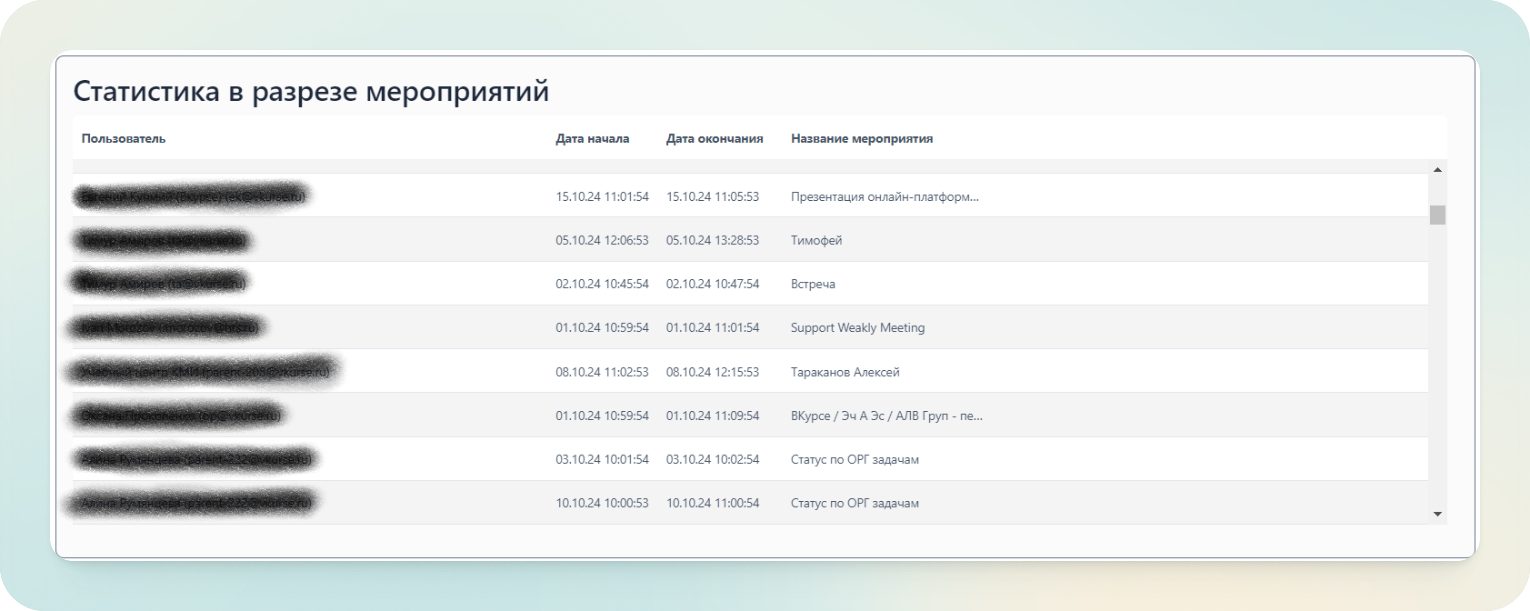
Event statistics allow you to see who, when, and what event was created. If you click on the column name, the data will be filtered by that indicator.
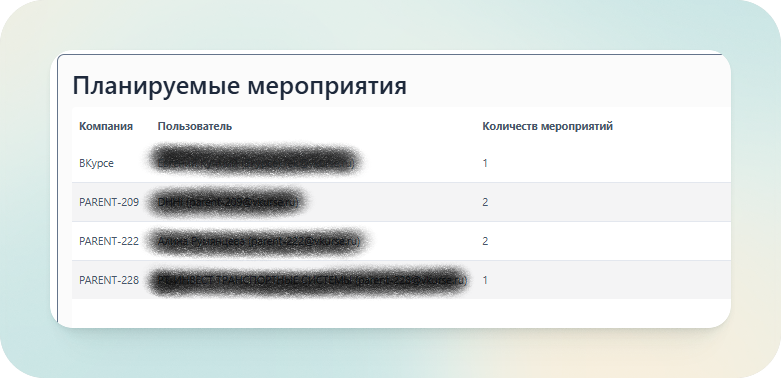
Planned events show the number of events planned under each user (to understand future load, platform usage activity).
Disk usage shows what volume of storage is used by individual employees, to understand which accounts are the most loaded. Only the meeting organizer and data owner can delete files to clear the disk.
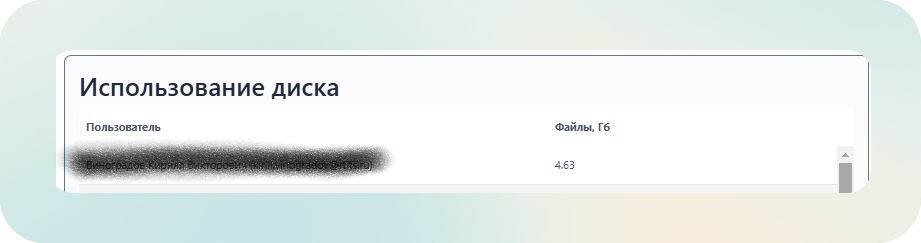
The total volume of used file storage is displayed at the top of the page.